Realtor.com released the 2026 edition of its housing affordability report cards for all 50 states plus the District of Columbia, showing a clear regional tilt toward the Midwest and the South. The update indicates that while no state earned an A+ grade, 12 of the 13 states with the highest marks come from these two regions, with grades ranging from B- to A. The study assesses affordability and new-construction activity, splitting roughly half of the score to each component.
Indiana led the pack with a total score of 76.3 out of 100, earning an A for a combination of strong affordability and robust housing construction. The report notes Indiana’s median-priced home at $295,810, and a typical household income of $71,469, placing the cost burden just below the 30% affordability threshold for many buyers. Iowa joined Indiana in the A tier, recording a median listing price of $282,886 and a median income of $75,991, underscoring how price points and incomes align to sustain affordability in that state.
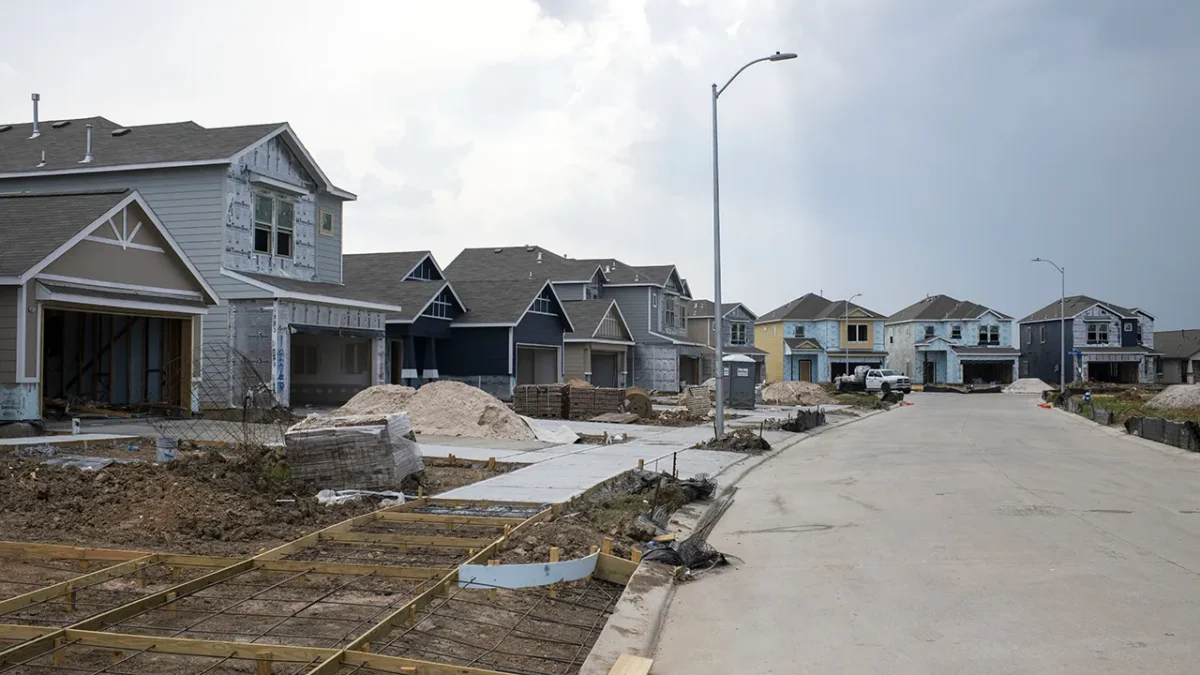
South Carolina, the 2025 leader, remained in the A tier, with a median listing price of $363,896 and a median income of $67,758. Texas earned an A- thanks to a median listing price of $364,749 and a median income of $76,585, reflecting continued strong housing demand alongside resilient incomes. North Carolina and Nebraska were the only two states to receive B+ grades, signaling mid-range outcomes as they balance new construction with affordability.
Delaware and Utah were among the biggest risers, each jumping 12 spots year over year, with Delaware moving from 19th to 7th and Utah climbing from 29th to 17th. The source note adds that the refresh exposes a familiar regional divide but also notable shifts beneath the surface, including a new state at the top of the class and several states whose grades moved markedly in either direction.
Six states earned F grades, with New York ranking last due to a median listing price of $668,173 and a median income of $82,657. The bottom tier also included Massachusetts, Rhode Island, Hawaii, California and Connecticut, illustrating continued affordability challenges in parts of the Northeast and West.
The Realtor.com framework places roughly half the weight on affordability and half on housing activity, the editors say, highlighting how price levels and construction momentum interact. The report’s authors stress that affordability remains highly location-specific, with the Midwest and South offering pockets of relief for buyers even as nationwide conditions stay challenging in several regions.
Economists and housing analysts say the results point to a regional pattern where supply, zoning, and wage growth converge more favorably in the Midwest and South than in more expensive coastal markets. The analysis underscores that policy levers and land availability continue to shape access to housing across the country.
Other details in the state-by-state grades show Indiana, Iowa and North Carolina clinching A grades, Texas an A-, and Delaware and Utah rising into the upper tier. The report notes a number of states near the bottom maintaining their lower standings, with several posting little movement from last year as listing prices remain elevated relative to incomes. The full list spans all 50 states and the District of Columbia, showing a broad spread of outcomes across the country.
Investors and policymakers may watch how affordability and construction dynamics evolve in the Midwest and South, where price pressure appears more manageable than in several coastal states, even as construction activity continues to play a major role in shaping access to housing across the nation.